Gender Pay Gap, as reported by employers, has increased since 2018, but decreased since 2020.
Due to the transition in quarto, interactivity in figures has been deactivated.
Key findings
Pros
Employers in “Health” sector are the most equalEmployers occupying more employees report a lower Gender Pay Gap
Cons
The gender pay gap is not the same across the UK
London-based employers seem to favour more men
What I explore in this blog?
In this blog, I want to explore:
Has gender pay gap (GPG) increased since 2018?
Are women paid better in certain areas in the UK?
Which sector(s) concentrate more equal-paying employers?
To explore how the pay gap between male and female employees has changed in the UK since 2018, I use the data from gender-pay-gap.service.gov.uk. These are data as reported by employers with 250 or more employees who compare men and women’s average pay across the organisation. In particular, I need information on the (a) difference reported, (b) employers’ postcode and (c) employers’ SIC codes.
Disclaimer: This analysis is only descriptive and does not suggest anything causal.
Data dictionary
Gender Pay Gap
Below you can find the available variables as adopted from gender-pay-gap.service.gov.uk.
| Field | Description | Source |
|---|---|---|
| EmployerName | The name of the employer at the time of reporting | Via CoHo API or manually entered by user when adding an employer to their account |
| EmployerID | Unique ID assigned to each employer that is consistent across every reporting year | Generated by the system |
| Address | The current registered address of the employer | Via CoHo API or manually entered by user when adding an employer to their account |
| PostCode | The postal code of the current registered address of the employer | Via CoHo API or manually entered by user when adding an employer to their account |
| CompanyNumber | The Company Number of the employer as listed on Companies House (null for public sector) | Via CoHo API |
| SicCodes | List of comma-separated SIC codes used to describe the employer’s purpose and sectors of work at the time of reporting | Via CoHo API or manually entered by user when adding an employer to their account |
| DiffMeanHourlyPercent | Mean % difference between male and female hourly pay (negative = women’s mean hourly pay is higher) | Entered by a user when reporting GPG data |
| DiffMedianHourlyPercent | Median % difference between male and female hourly pay (negative = women’s median hourly pay is higher) | Entered by a user when reporting GPG data |
| DiffMeanBonusPercent | Mean % difference between male and female bonus pay (negative = women’s mean bonus pay is higher) | Entered by a user when reporting GPG data |
| DiffMedianBonusPercent | Median % difference between male and female bonus pay (negative = women’s median bonus pay is higher) | Entered by a user when reporting GPG data |
| MaleBonusPercent | Percentage of male employees paid a bonus | Entered by a user when reporting GPG data |
| FemaleBonusPercent | Percentage of female employees paid a bonus | Entered by a user when reporting GPG data |
| MaleLowerQuartile | Percentage of males in the lower hourly pay quarter | Entered by a user when reporting GPG data |
| FemaleLowerQuartile | Percentage of females in the lower hourly pay quarter | Entered by a user when reporting GPG data |
| MaleLowerMiddleQuartile | Percentage of males in the lower middle hourly pay quarter | Entered by a user when reporting GPG data |
| FemaleLowerMiddleQuartile | Percentage of females in the lower middle hourly pay quarter | Entered by a user when reporting GPG data |
| MaleUpperMiddleQuartile | Percentage of males in the upper middle hourly pay quarter | Entered by a user when reporting GPG data |
| FemaleUpperMiddleQuartile | Percentage of females in the upper middle hourly pay quarter | Entered by a user when reporting GPG data |
| MaleTopQuartile | Percentage of males in the top hourly pay quarter | Entered by a user when reporting GPG data |
| FemaleTopQuartile | Percentage of females in the top hourly pay quarter | Entered by a user when reporting GPG data |
| CompanyLinkToGPGInfo | Voluntary link to additional GPG data published by the reporting employer | Entered by a user when reporting GPG data |
| ResponsiblePerson | The name of the responsible person who confirms that the published information is accurate - Employers covered by the private sector regulations only | Entered by a user when reporting GPG data |
| EmployerSize | Number of employees employed by an employer | Entered by a user when reporting GPG data |
| CurrentName | The current name of the employer | Via CoHo API or manually entered by user when adding an employer to their account |
| SubmittedAfterTheDeadline | TRUE/FALSE value showing whether the employee submitted their GPG data after the relevant reporting deadline. If a report is updated after the initial submission, it is marked as late only if the figures are changed | Generated by the system |
| DueDate | The date that the GPG data should have been submitted by. Format: dd/MM/yyyy HH:mm:ss | Generated by the system |
| DateSubmitted | Date that GPG data was submitted (if this was updated after the initial submission, this date also changes). Format: dd/MM/yyyy HH:mm:ss | Generated by the system |
Postcodes
National Statistics Postcode Lookup (NSPL) for the United Kingdom
SIC codes
SIC codes. A converter between Sub-classes (5-digit codes) to Classes (4-digit), Groups (3-digit), Divisions (2-digit) and Sections (1-digit) is available in this github repository.
Are women paid more or less than men?
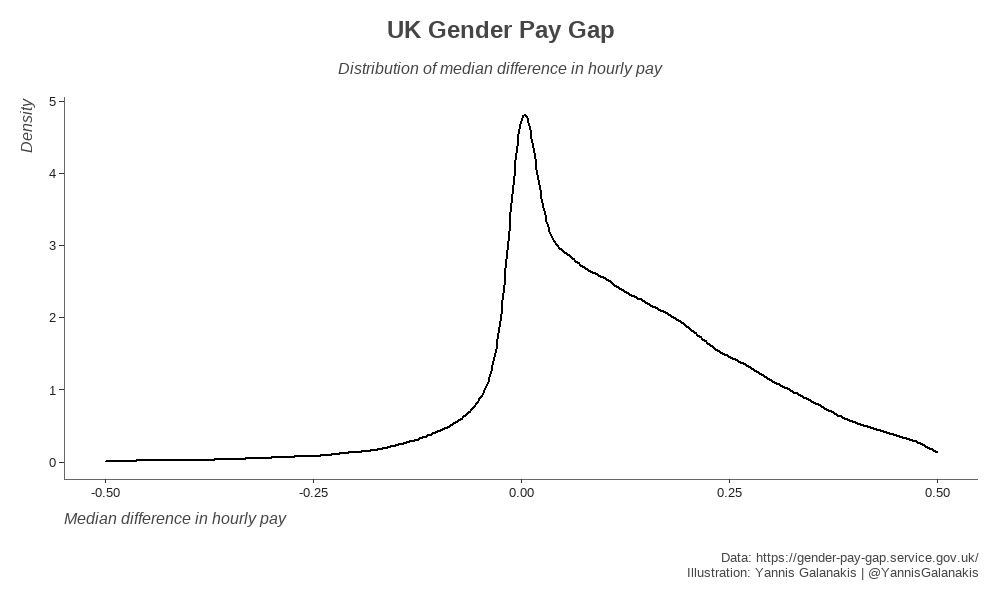
First, I explore if there is any need for this blog. In other words, if the median difference between male and female pay is zero, there is equal pay among employees. Hence, women are compensated as much as men.
Below, figure plots the distribution of the median difference in hourly pay between men and women. More employers stand on the positive side (i.e. women earn less than men) than the negative one (i.e. women earn more). Looking at particular SIC codes, though, we find some examples of negative difference, and hence, of women’s greater compensation.
Which country in the UK concentrates the most fair employers?
How has the GPG changed over time by country? Below, I use the postcodes of each employer and match it to the National Statistics Postcode Lookup. Then, I assing each postcode to countries based on the region’s name. Finally, I calculate the median difference in hourly pay by country. For completeness, the figure below reports the UK national paygap, too.
In the case of England, there may be a concern that London drives the result. This is why, I exclude London from England and report it separately.
Download data as: Download graph as:
In the UK, the gap has increased since 2018 (pre-COVID19), but decreased since 2020. Northern Ireland presents the most significant downward changes. Scotland follows the downward trend, too. London has the greatest Gender Pay Gap.
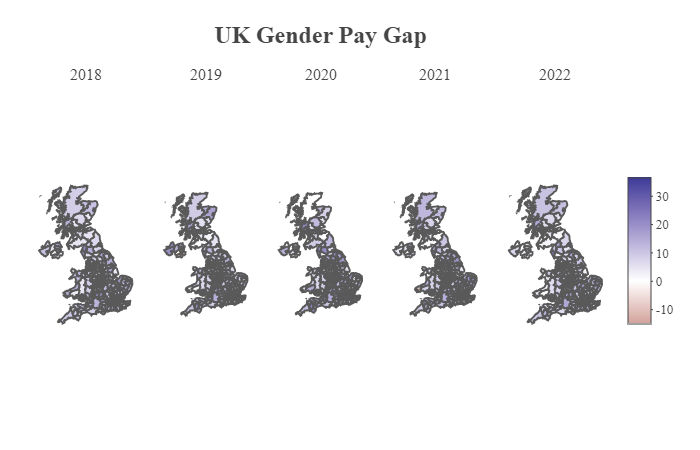
Is there equality in particular areas?
The figure of maps below plots the median GPG by local authority in the UK. It compares changes across different regions since 2018. Areas in pink concentrate greater pay for women (i.e. GPG takes negative values), while areas in blue concentrate greater pay for men (i.e. GPG takes positive values). Finally, areas in white have equal pay between men and women (i.e. GPG is zero).
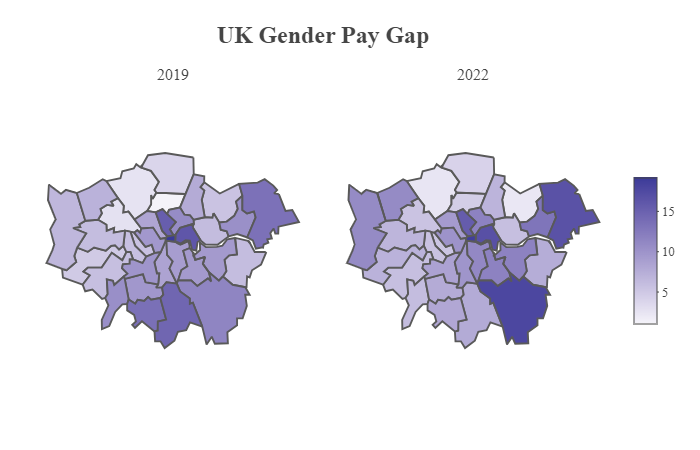
Since London presents the greatest GPG in the UK and it presents an increasing trend since 2019, I compare the GPG in London in 2019 vs. 2022.
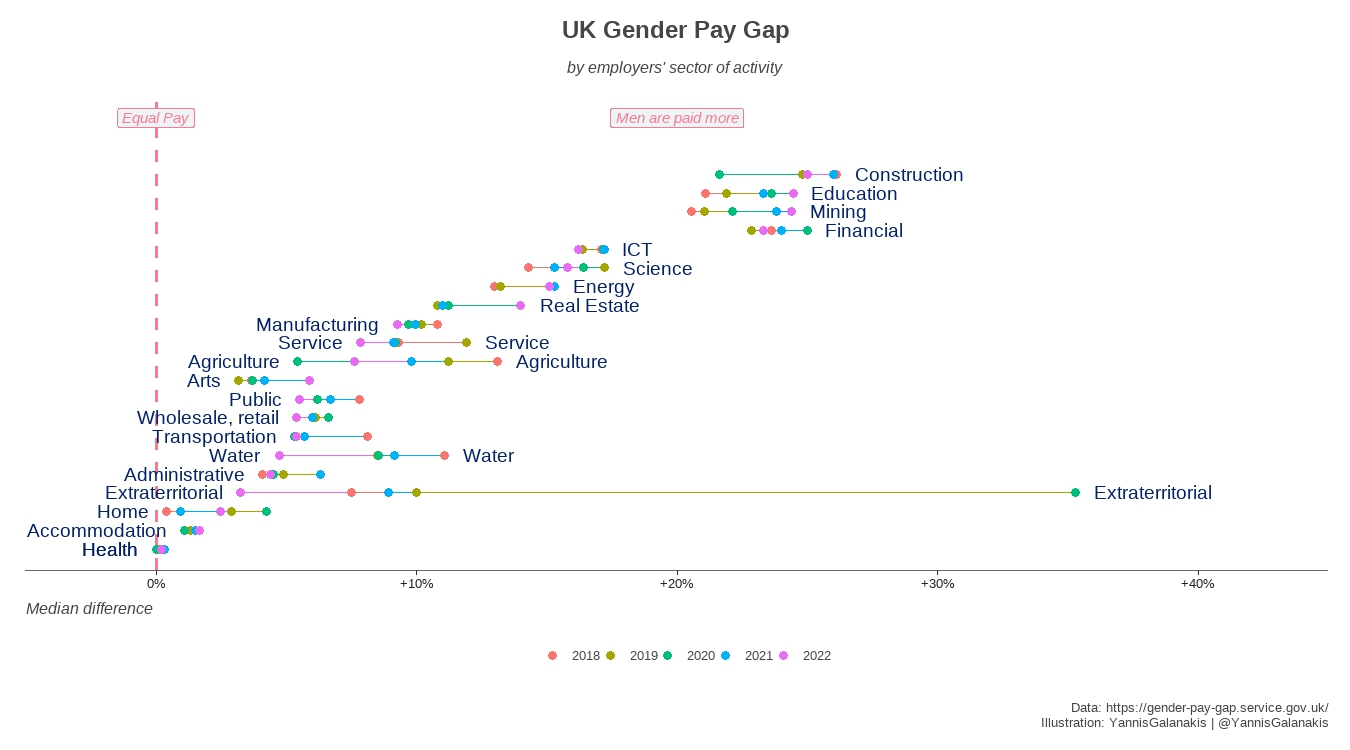
Which sector concentrates the most equal-pay employers?
Figure plots the median difference of hourly pay by 1-digit SIC code across all areas in the UK by year. It shows that most of the equal-pay employers are concentrated in Health, followed by Accommodation. The greatest GPG is in Construction and Education.
 Download data as:
Download data for 4-digit SIC:
Download graph as:
Where should I want to work?
The following table presents the 4-digit SIC sectors1 in which we find 10 companies with the greatest (bottom 10; men earn more) or lowest (top 10; women earn more; table) gender pay gap.
1 I report the sectors instead of the employers with the greatest/lowest GPG to avoid any framing.
Interpretation of bottom and top 10 in terms of GPG
Bottom 10: For example, say a company reports a median difference of hourly pay 80%. This means that if a woman earns £1, her male counterpart earns £5.
Top 10: For example, say a company reports a median difference of hourly pay -80%. This means that if a woman earns £1, her male counterpart earns £0.56.
| 4-digit SIC | Description |
|---|---|
| 5610 | Restaurants and mobile food service activities |
| 5510 | Hotels and similar accommodation |
| 4110 | Development of building projects |
| 2511 | Manufacture of metal structures and parts of structures |
| 8299 | Other business support service activities n.e.c. |
| 8520 | Primary education |
| 8621 | General medical practice activities |
| 4-digit SIC | Description |
|---|---|
| 7830 | Other human resources provision |
| 8010 | Private security activities |
| 4299 | Construction of other civil engineering projects n.e.c. |
| 2562 | Machining |
| 8299 | Other business support service activities n.e.c. |
| 5510 | Hotels and similar accommodation |
| 7820 | Temporary employment agency activities |
| 9312 | Activities of sport clubs |
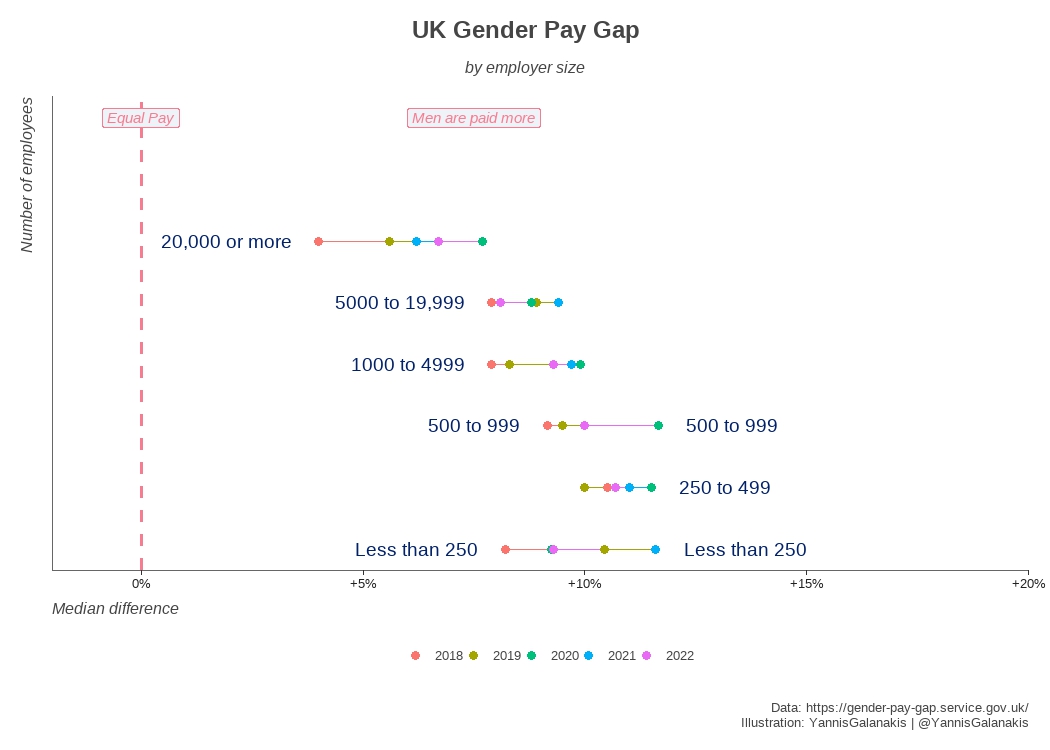
The bigger firms advantage
Does the size of the employer play any role on the GPG? Figure plots the median difference of hourly pay between men and women by employer’s size. It shows that employers who occupy more employees report lower GPG.